

You run an ecommerce retail business and need to make a profit. You’ve set a minimum price for your merchandise, but you’d like to get more. Meanwhile, prospective customers have their own ideas about price. They’ve set a limit on what they’re willing to pay.
You and your customers want a mutually beneficial transaction, and in the process create what economists call an economic surplus. Here’s a rundown on this economic concept and what it means for your business.
✂️ Shortcuts
What is economic surplus?
Economic surplus is a macroeconomic concept that refers to the net benefits enjoyed by consumers and producers in the marketplace. It is also sometimes called social surplus or total social welfare.
Consumers benefit to the degree they pay a price less than the maximum price they were willing to pay. This is called the consumer surplus. Producers benefit from getting any price above the minimum price they’re willing to accept. This is called the producer surplus. Total economic surplus combines all the varying amounts of individual consumer and producer surpluses. The balance of economic surplus between consumers and producers is constantly changing, a reflection of fluctuating prices in marketplaces.
What causes economic surplus?
Economic surplus is the result of market efficiency—meaning buyers and sellers share some of the benefits of a transaction in such a way as to lead to the maximum net benefit.
The idea of market efficiency is connected to the economic principle of supply and demand. Below is a basic supply and demand diagram.
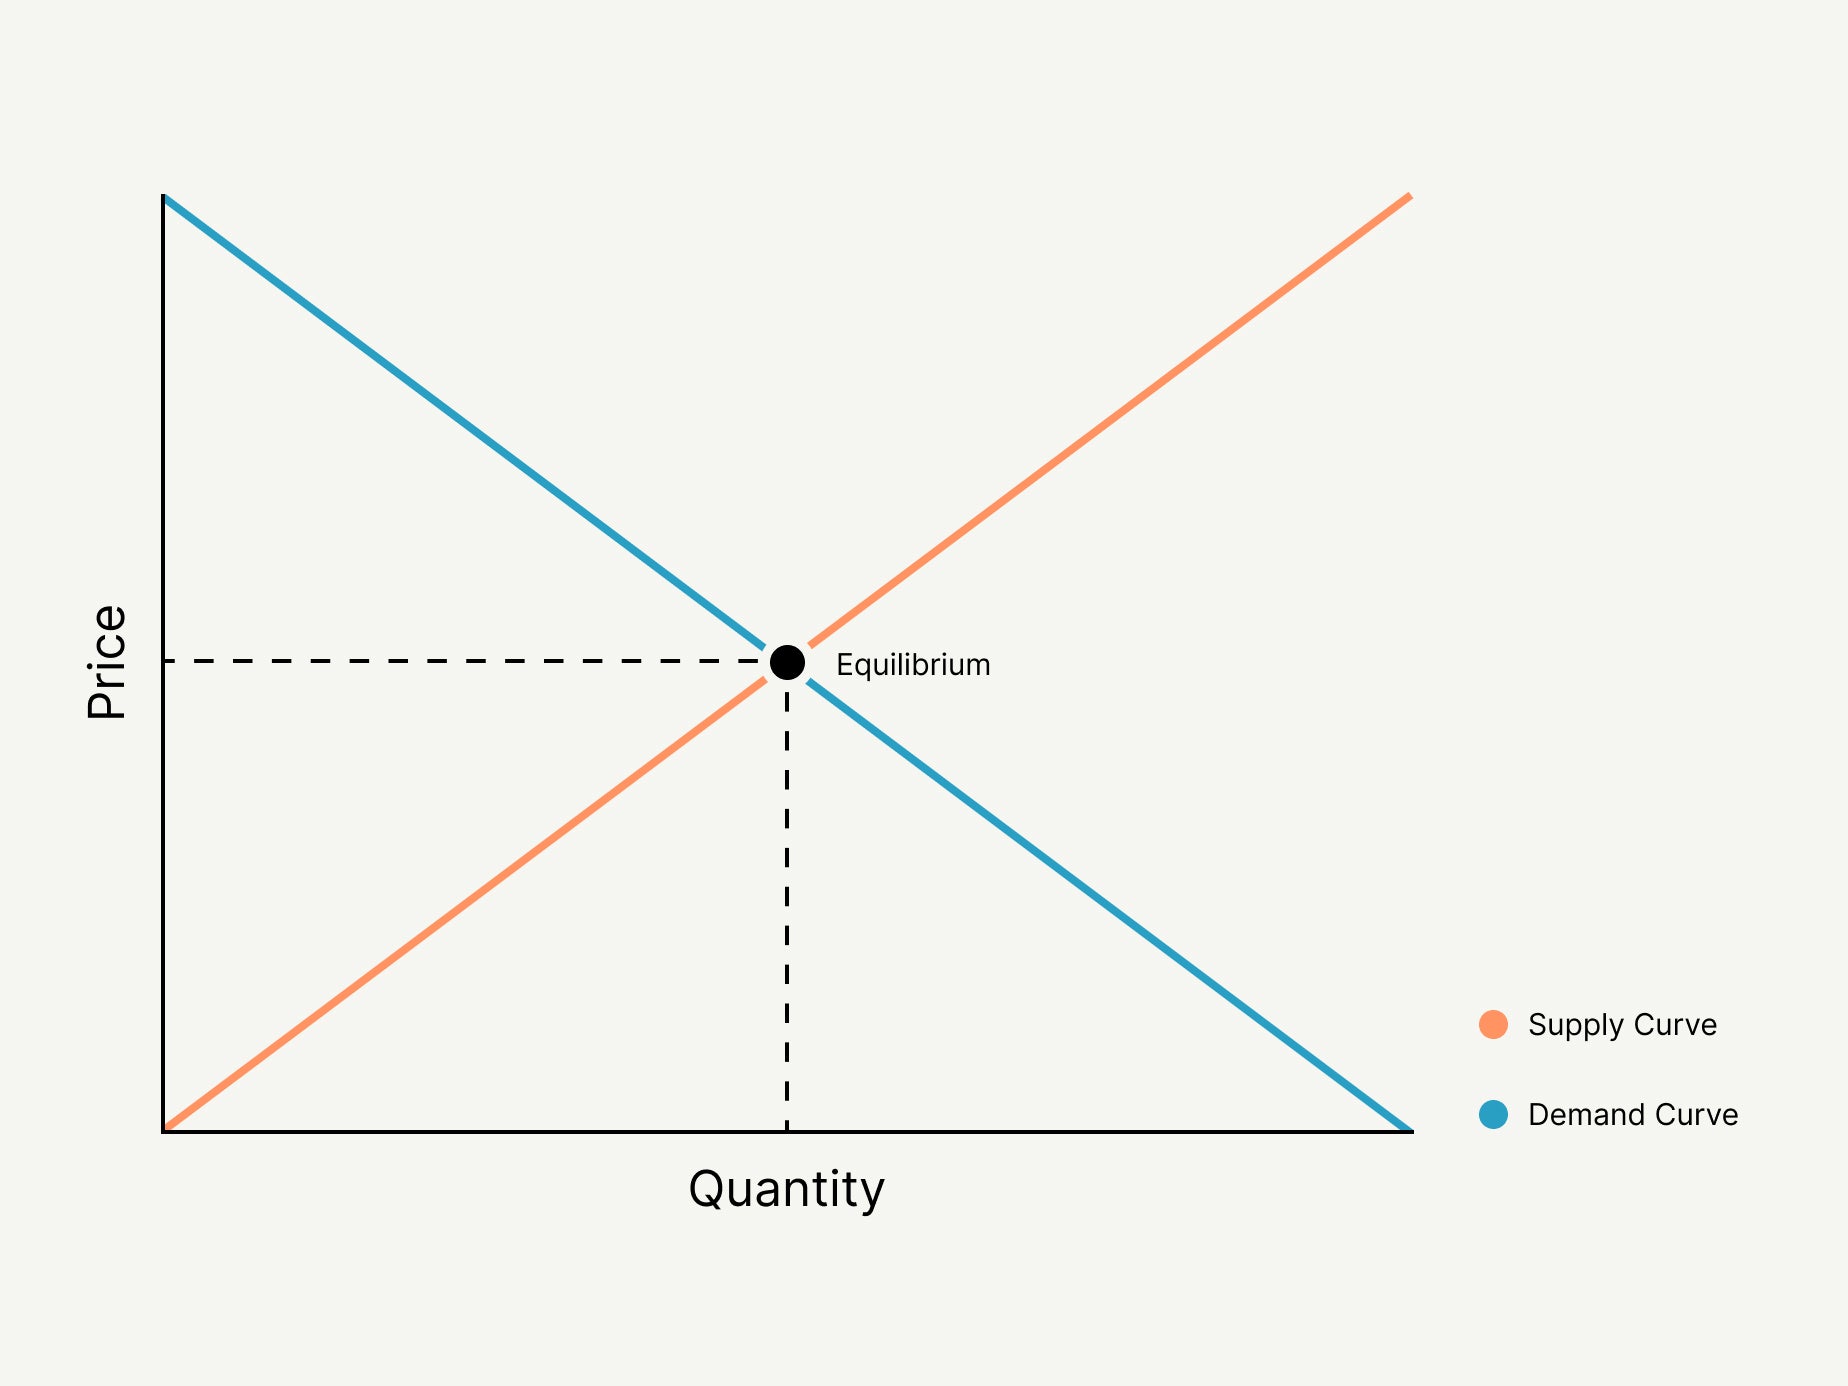
The horizontal axis measures supply—the quantity of a particular good producers provide—while the vertical axis tracks demand for the good, measured by price. The red diagonal line rising from left to right is called the supply curve. The blue diagonal declining from left to right is called the demand curve.
Where the curves intersect is known as the equilibrium point. The dotted vertical line marks the equilibrium quantity, and the dotted horizontal line marks the equilibrium price, which also is the market price.
Equilibrium represents the most efficient allocation of resources by consumers and producers—the amount of goods produced equals the amount consumers want, resulting in a stable price. The area inside the triangle to the left of the equilibrium point, and delineated by the supply and demand curves, represents economic surplus. At market equilibrium, consumers and producers get the most combined benefit from transactions.
Markets typically look to achieve a balance, to some degree, with supply and demand fluctuating as consumers and producers seek equilibrium. As a result, economic surplus fluctuates. In competitive markets with many producers, prices generally are lower, and consumers get a bigger portion of the total surplus. In markets dominated by one or a few producers with some pricing power, the producers get a bigger share of economic surplus.
Economic surplus example
You run a small business and you would like shoppers to pay the full regular price for your merchandise. You also have a minimum price you need to set to keep the business going. At the same time, your customers are angling for a discount.
Now imagine you end up selling at 20% below the maximum price you hoped for, but it’s still 15% higher than your minimum. For your customers, that’s a bargain, while for you the sale price is profitable. Economists would consider this an economic surplus, because both you and your customers got prices better than your worst-case expectations.
Consumer surplus vs. producer surplus
To explain consumer surplus and producer surplus, let’s look at another supply-and-demand graph. This one is more realistic because it shows the surpluses are unequal, and it shows the supply curve starting at a nonzero point on the vertical axis, reflecting the producer’s minimum price to cover costs of production. Let’s assume the y-axis prices are in dollars and the horizontal axis quantity is the number of products.
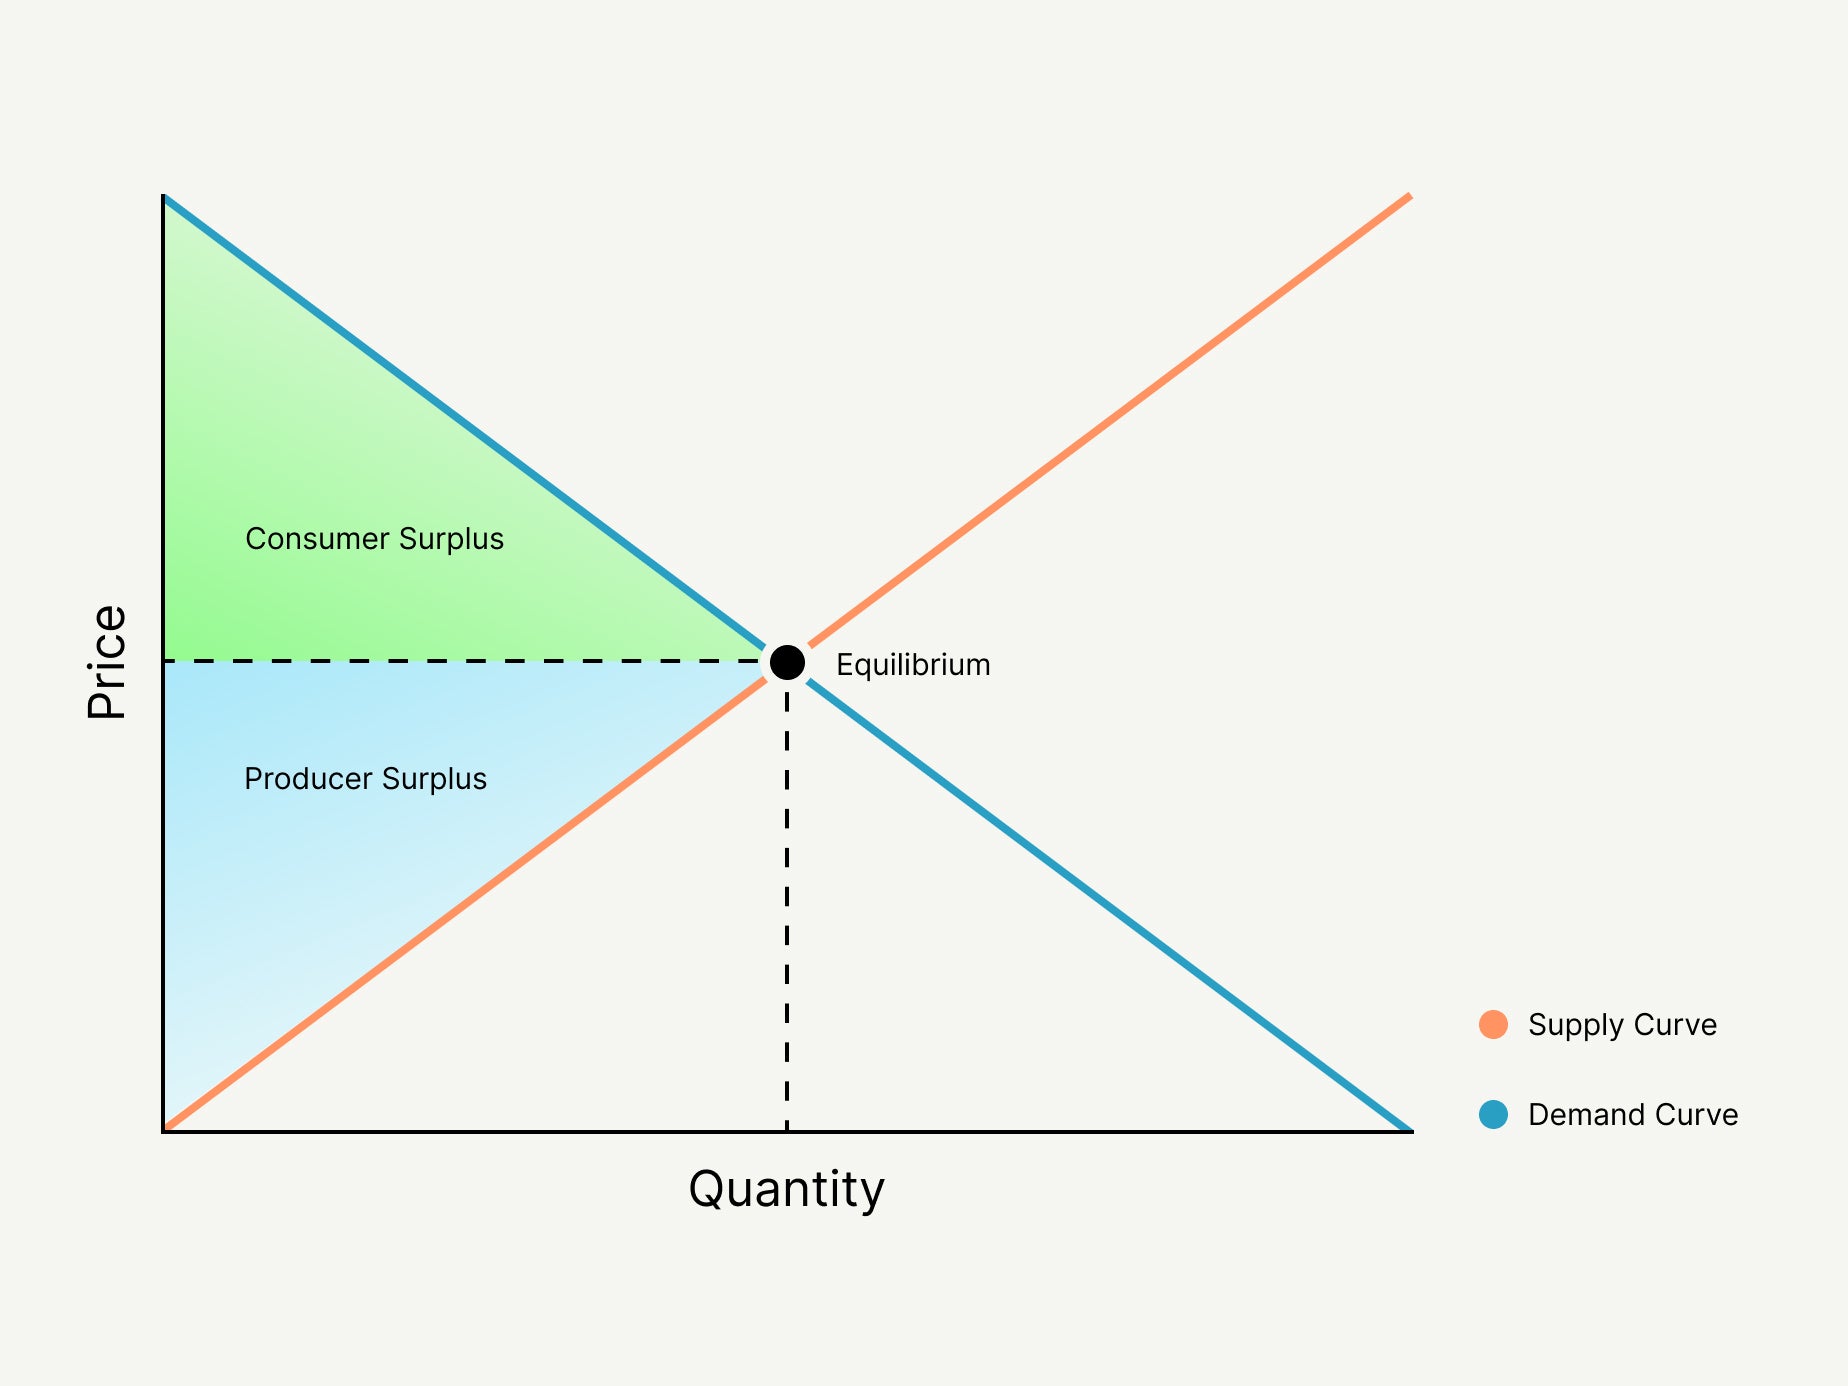
Consumer surplus is the difference between the maximum price a consumer would be willing to pay for something and the price actually paid, or the market price. This surplus is represented by the green shaded area in the graph.
Moving from left to right in the green area, the amount of consumer surplus diminishes as the gap between the market price and demand curve narrows to the equilibrium point.
The producer surplus is the difference between the minimum price the producer needs and the price the producer actually gets—again, the market price. This is shown by the light-blue shaded area.
Similarly moving from left to right in the blue area, the amount of producer surplus diminishes as the gap between market price and supply curve narrows to the equilibrium point.
This graph illustrates a principle of classical economics known as the law of diminishing marginal utility: Consumers get progressively less satisfaction, or utility, from each additional purchase of a product as their demand wanes, and producers get progressively less profit (also considered utility) from additional sales as supply increases.
What is the economic surplus formula?
To calculate the economic surplus in a market, add the consumer surplus and producer surplus.
Total economic surplus = consumer surplus + producer surplus
That’s simple enough, but it first requires separate calculations for the consumer surplus and producer surplus. Let’s refer back to the graph of supply and demand curves, and where they intersect (the equilibrium point), to help illustrate the calculations.
In the graph above, the equilibrium price is $50, and the equilibrium quantity is 40. The consumer and producer surpluses are right triangles, and from basic geometry, a right triangle’s area is simply half of the associated rectangle.
Therefore, the consumer surplus calculation looks like this:
(½) [Equilibrium quantity x (maximum acceptable price - equilibrium price)]
And the producer surplus calculation is:
(½) [Equilibrium quantity x (equilibrium price - minimum acceptable price)]
In the graph above, the equilibrium quantity is 40. The highest price consumers are willing to pay is $70, and the equilibrium (market) price is $50. Per the formula above, we calculate consumer surplus:
Consumer surplus = (½) [40 x ($70 - $50)] = (½) [40 x $20] = $400
Similarly, for producer surplus, we use the equilibrium quantity of 40, the equilibrium price of $50, and a minimum price the producer would accept—equivalent to the cost of production. Let’s assume it’s $20 on the y-axis. We calculate producer surplus:
Producer surplus = (½) [40 x ($50 - $20)] = (½) 40 x $30 = $600
Now, total economic surplus can be calculated:
Economic surplus = $400 + $600 = $1,000
Economic surplus formula FAQ
How can economic surplus help my business stay competitive?
Your business can stay competitive by paying attention to consumer demand and adjusting the share of the total economic surplus you take. When demand weakens and you have excess product supply, you can lower prices to attract more customers, but in the process reduce your economic surplus. Conversely, when consumer demand strengthens and you don’t have enough products, you can raise prices while increasing production to meet the demand and wind up with a bigger slice of the economic surplus.
How can my business increase its economic surplus?
A well-run business balances its production and prices against consumer demand for its products. The business and its customers share an economic surplus by moving toward market equilibrium. A profitable business—one with a producer surplus—could invest profits in expansion or increased production. Meanwhile, if consumers have a surplus, they can afford to buy more of your products.
When does economic surplus reach its maximum?
Total surplus reaches its maximum at the point of equilibrium, when the optimal combination of product price and product quantity is achieved. A price higher than the market price leads to a product surplus, while a price below market will lead to a product shortage. In the first case, producers are forced to lower prices to attract more customers and sell their excess products. In the second, they will cut production to make products scarcer, driving up prices in the face of customer demand.