

What is Google Analytics?
Google Analytics is a free website analytics platform that offers a wealth of insights that improve the understanding of your website audience, their acquisition, behavior, and profitability.
Getting to know Google Analytics will pay for itself many times over, as you make data-informed changes about your online store, visitor behavior on your website, and where your traffic is coming from—information that can be harnessed to find new customers and prevent lost sales. What’s more, with the recent shift to Google Analytics 4, the free analytics tool is now simpler to use and more accurate.
Still, for the average store owner, Google Analytics has a pretty steep learning curve. So to help you get started, we’ve pulled together a comprehensive guide covering everything you need to know to set up Google Analytics for your online store, thebasic reportsyou should be checking regularly as an ecommerce entrepreneur, and a few other goodies to help you get the most out of the latest version of Google Analytics for ecommerce.
Why you need Google Analytics to grow your ecommerce store
If you ran a retail store, you’d be able to see firsthand how many customers are walking around your store and what products they’re browsing, adding to their basket, or putting back on the shelves.
Setting up ecommerce analytics and tracking therelevant KPIsnot only unlocks that information and more, it also helps you answer more granular questions about visitor behavior, like:
- What are the most-visited products and pages on your website?
- On average, how much time are people spending on a particular page?
- Which pages on your website drive the most revenue for your business?
- How valuable is traffic from search engines vs. social media ads?
- Which marketing campaigns or channels are bringing in low-quality traffic that leaves without taking further action?
- How many of your visitors are new vs. returning?
- What percentage of visitors add a product to their cart and what percentage of those people actually complete checkout?
- What are the most popular devices your website is viewed on?
The answers to these questions and more can be found in Google Analytics and actioned in your marketing strategy, website design, product development, pricing strategy, copywriting, and business decisions, both big and small.
Imagine you’ve been driving traffic to your product page for a month but have yet to make a single sale. You want to know why so you can make the right changes.
Without Google Analytics,you don’t know where to start. Is the problem that your product page isn’t enticing people to click Add to Cart? Or are surprise shipping costs at checkout scaring people off?
With Google Analytics, you’re able to see most of your traffic is coming from Facebook Ads and has a low engagement rate. You can now narrow your diagnosis—maybe you’re driving the wrong traffic or need to warm people up more with your ad creative or product description?
Google Analytics empowers informed decision-making about your business. Otherwise, you’re just guessing in the dark.
“As an ecommerce business, I use Google Analytics to break down the sales funnels we’ve been building for Bull & Cleaver. It’s helped us diagnose ‘leaks’ in the experience and fix them.”
How to set up Google Analytics for your ecommerce site
Google Analytics takes only a few clicks to set up, but the exact steps depend on your website platform. If you’re using Shopify, getting started is as simple as creating a new account inGoogle Analyticsand navigating to yourShopify Google channel appto install your Google Analytics tag on your website.
1. Sign up for Google Analytics
To get started with Google Analytics, you’ll first need a free Google account. If you already have a Gmail account, you’ll be able to use that. If not,create your Google account, then visitGoogle Analyticsand click the button in the top right corner to get started.
2. Set up an account and your first property
If you’re starting from scratch, once you’ve signed in to Google Analytics you’ll be prompted to create an account. This will set up a new profile to track your ecommerce site analytics. Most people use their name or business name. Click “Next” to add the first property to your account.
If you’re not starting from scratchand already have a Google Analytics account, you can create a new property by selecting “Admin”, then “+Create Property” under the “Property” column.
Note:You can track multiple properties under the same account. Say you want to track your online store, mobile app, and blog—you can do so by creating additional properties under the same account for each platform. And if you need to get back to them later, you can always access your accounts and properties any time in the “Admin” section of Google Analytics by clicking the gear icon in the bottom left.

Whether you are new to Google Analytics or not, the next steps to create your property will be the same.
On the next screen, enter a name, currency, and reporting time zone for your new property. A user visit will be reported in whichever time zone you select, even if it’s different from the user’s time zone. Reporting time zones update for daylight savings time automatically.
Click “Next”, and enter your industry category and business size.
You’ll then click on “Create”, and accept the “Analytics Terms of Service and the Data Processing Amendment”.
3. Install your Google Analytics tag on your website
Once you’ve created the data stream for your property, you’ll have to add atagto your website so Google Analytics can track your visitors. For that, you will need toinstall theGoogle Channel app.
If you do not yet have it installed, go to your “Online Store Preferences”, and select “Update account” in the Google Analytics module. It’ll then prompt you to install the Google Channel, where you’ll click “Connect your Google Account”. Select your Google Analytics 4 property from the drop down menu, and connect your property.
If you already have the Google Channel app installed, you can go into the app and select the “Optimize Your Business with Google Analytics” home card, select your Google Analytics 4 property, and connect your property.
4. Set up Conversion Actions and Audiences
If you’re starting from scratch, you’ll want to link your Google Analytics 4 property to Google Ads and enable Personalized Advertising. This way, your audiences will be available in your shared library on Google Ads.
Afterwards, you can add the Google Analytics 4 audiences to your campaign or ad group by opening the “Audiences” section and adding them to your targeting options.
If you have been using Universal Analytics audiences, it’s important that you migrate audiences to your Google Analytics 4 Property.
To do that, you’ll want to link your Google Analytics 4 property to Google Ads and enable Personalized Advertising. This way, your audiences will be available in your shared library on Google Ads.
Afterwards, you can add the Google Analytics 4 audiences to your campaign or ad group. Duplicates from Universal Analytics and Google Analytics 4 will be removed automatically.
Be sure to the campaign or ad group where you deployed Universal Analytics audiences and open the Audiences section, where you’ll add the Google Analytics 4 audiences to the targeting options in addition to the Universal Analytics audiences.
5. Track your conversions through events
If you are new to Google Analytics,you will see thatconversionsare measured through events. You will create or identify an event that measures the important user interaction and then mark the event as a conversion within Google Analytics. Seethis Google documentfor details.
If you have been using Universal Analytics,you may know that in Universal Analytics conversions were measured by setting up goals and ecommerce transactions. In Google Analytics 4,conversionsare measured through events.
To switch over, you’ll need toset up events and mark them as conversions through Google Analytics 4.
NOTE:Check out more detailed step-by-step instructions for setting upGoogle Analytics on the Shopify platformhere.
Setting up Google Analytics for Enhanced Ecommerce
Google Analytics also offers ecommerce-specific tracking to get access to more relevant insights for your business.
WithBasic ecommerce trackingin Google Analytics you get transaction and revenue data (e.g., revenue generated by your online store), whileEnhanced ecommerce trackingoffers additional information about visitor behavior for specific products at different stages of the purchasing process (e.g., the ratio of product views to purchases). Since you’re running an ecommerce business, that extra granularity is well worth it.
You can enableEnhanced ecommercein Shopify underOnline Store > Preferencesto make sure all relevant behavioral data on your Shopify store shows up in your Google Analytics reports.
I find Google Analytics is great for modeling visitor behaviors, whereas Shopify Reports is what I use for analyzing our sell-through rates and merchandising mix of our products. Together, the two help us optimize our website and our product mix on it.
5 essential Google Analytics reports for ecommerce
Google Analytics has a lot of reports, which can be customized a hundred different ways. But if you’re just starting out, you can still get a lot of valuable insights out of the built-in reports that come ready to go in Google Analytics.
Report categories in Google Analytics are broken down in the menu on the left:
- Real-timeshows you what’s happening on your siteright now, including how many active visitors are on it, where they’re from, and what pages they’re on.
- Acquisitionreports give you a historical view of the marketing channels, campaigns, and locations you’re “acquiring” your traffic, conversions, and revenue from.
- Engagementreports show how visitors are interacting with your website, your most popular pages, and what events they’re triggering (e.g., scrolling to the bottom or clicking Add to Cart”).
- Monetizationreports tell you how your website properties are making money, from number of purchasers to revenue generated.
- Retentiontells you how many returning visitors your website is getting and offers insights related to their engagement and purchasing behavior.
- Demographicsbreaks behavioral data down by country, city, language, age, and gender of your visitors.
- Tech显示设备的信息,浏览器,and screen sizes users are browsing your website with.
- Attributionreports plot your website visitors’ interactions with your marketing efforts on the path to purchase, giving you insight into your most valuable touchpoints.

Below, we’ll highlight some of the essential reports for ecommerce you should prioritize in Google Analytics.
Keep in mind for all reports (with the exception of Real-time reports), the default time period is the past 30 days. You can change the reporting period at any point by using the date selector in the top right corner.
Real-time report

The Real-time report is where you can monitor website traffic in real time. It’ll show you who is on your site at that very moment, which channels they came from, geographic “hot spots” for traffic visualized on a world map, and what pages they’re actively browsing.
Just clickReal-timein the navigation menu on the left to bring up this dashboard, with the option to drill down deeper by selecting one of the other reports under Real-time, including Locations, Traffic Sources, Page, Events, and Conversions.
With Google Analytics 4, there’s also aView user snapshotfeature, which gives you an anonymized view of a random user’s activity timeline and profile for a more zoomed in look at user behavior at an individual level.

What can you do with this information?
- Get a live view of traffic on your site during a big sale (e.g., Black Friday Cyber Monday).
- Monitor the immediate effects from an email campaign, influencer post, or other anticipated spike in traffic.
Acquisition reports

Acquisition reportsprovide insight about where yourecommerce store’svisitors, conversions, and revenue are coming from over time, providing invaluablemarketing analyticsacross all your channels and helping you uncover how to drive more visitors (and customers) to your store over time.
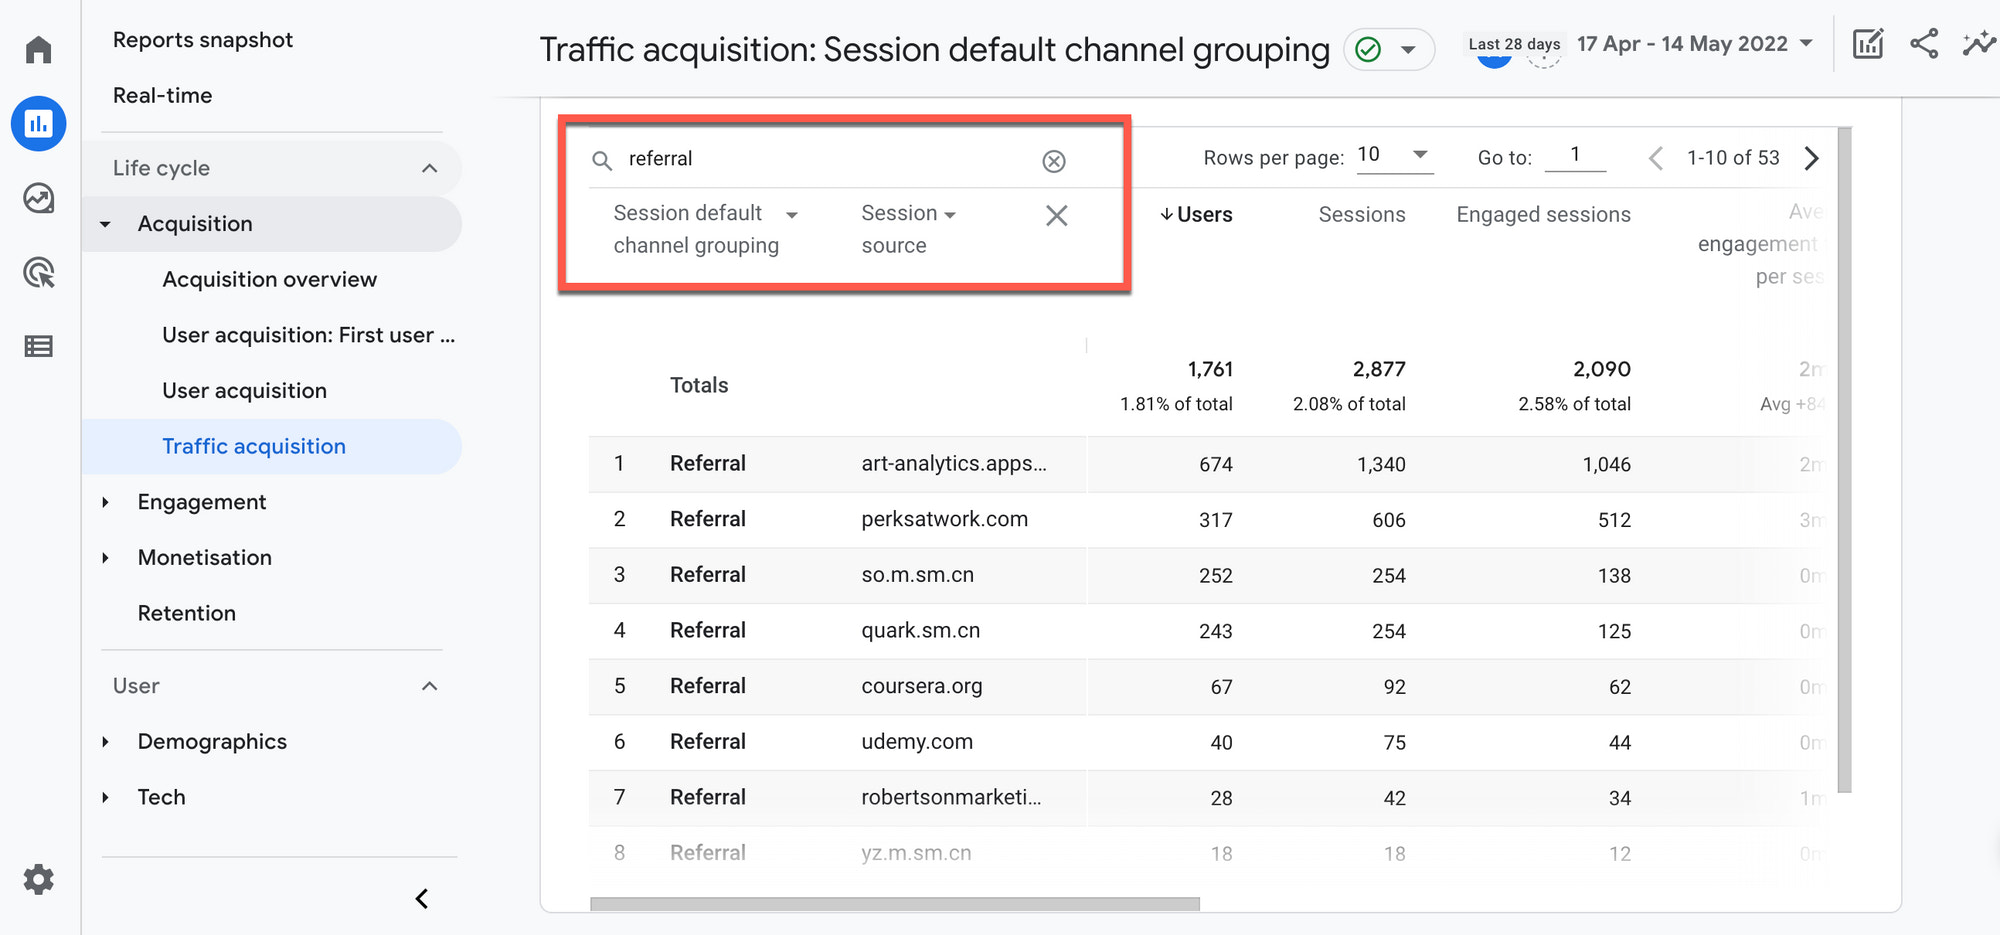
By default, there are three acquisition reports.Acquisition overviewoffers a high level summary of traffic generating activities and results, while theUser acquisitionreport breaks down new first-time users by channel within a given timeframe, and theTraffic acquisition reportdoes the same for all traffic from both new and returning users.
These reports will show you several key metrics for each source of traffic:
- Usersare the number of individual active users who have visited your site.
- Sessionsare the number of instances where a user has started browsing your website, which can include viewing multiple pages. By default, a session times out after 30 minutes of inactivity.
- Engaged sessionsare the number of sessions that lasted longer than 10 seconds, or had a conversion event, or had two or more screen or page views.
- Average engagement time per session反映了平均会话持续时间,用户were actively engaged.
- Engaged sessions per useris the number of engaged sessions that were triggered by a user on average.
- Events per sessionshows you how many events (e.g., viewing a page, clicking a button) were triggered per session on average.
- Engagement ratereflects the percentage of sessions that turned into engaged sessions.
- Event countshows the total number of events triggered by users on your site.
- Conversionsshows the total number of times users triggered conversion-specific events.
- Total revenueis the sum of all your monetization streams tracked in Google Analytics.
Within these reports, you can also drill down on specific channels like Referrals, layering on a dimension like Session source so you can see thedomain namesof websites that are linking to your store and driving referral traffic.
What can you do with this information?
- Know which channels are driving traffic and sales so you can focus on the channels that are most effective for you.
- Understand what other websites are linking to you and the volume of traffic they're driving so you can easily see where other opportunities may exist.
- Dig into how different channels are driving engaged traffic, conversions, and revenue for your business.
Engagement reports
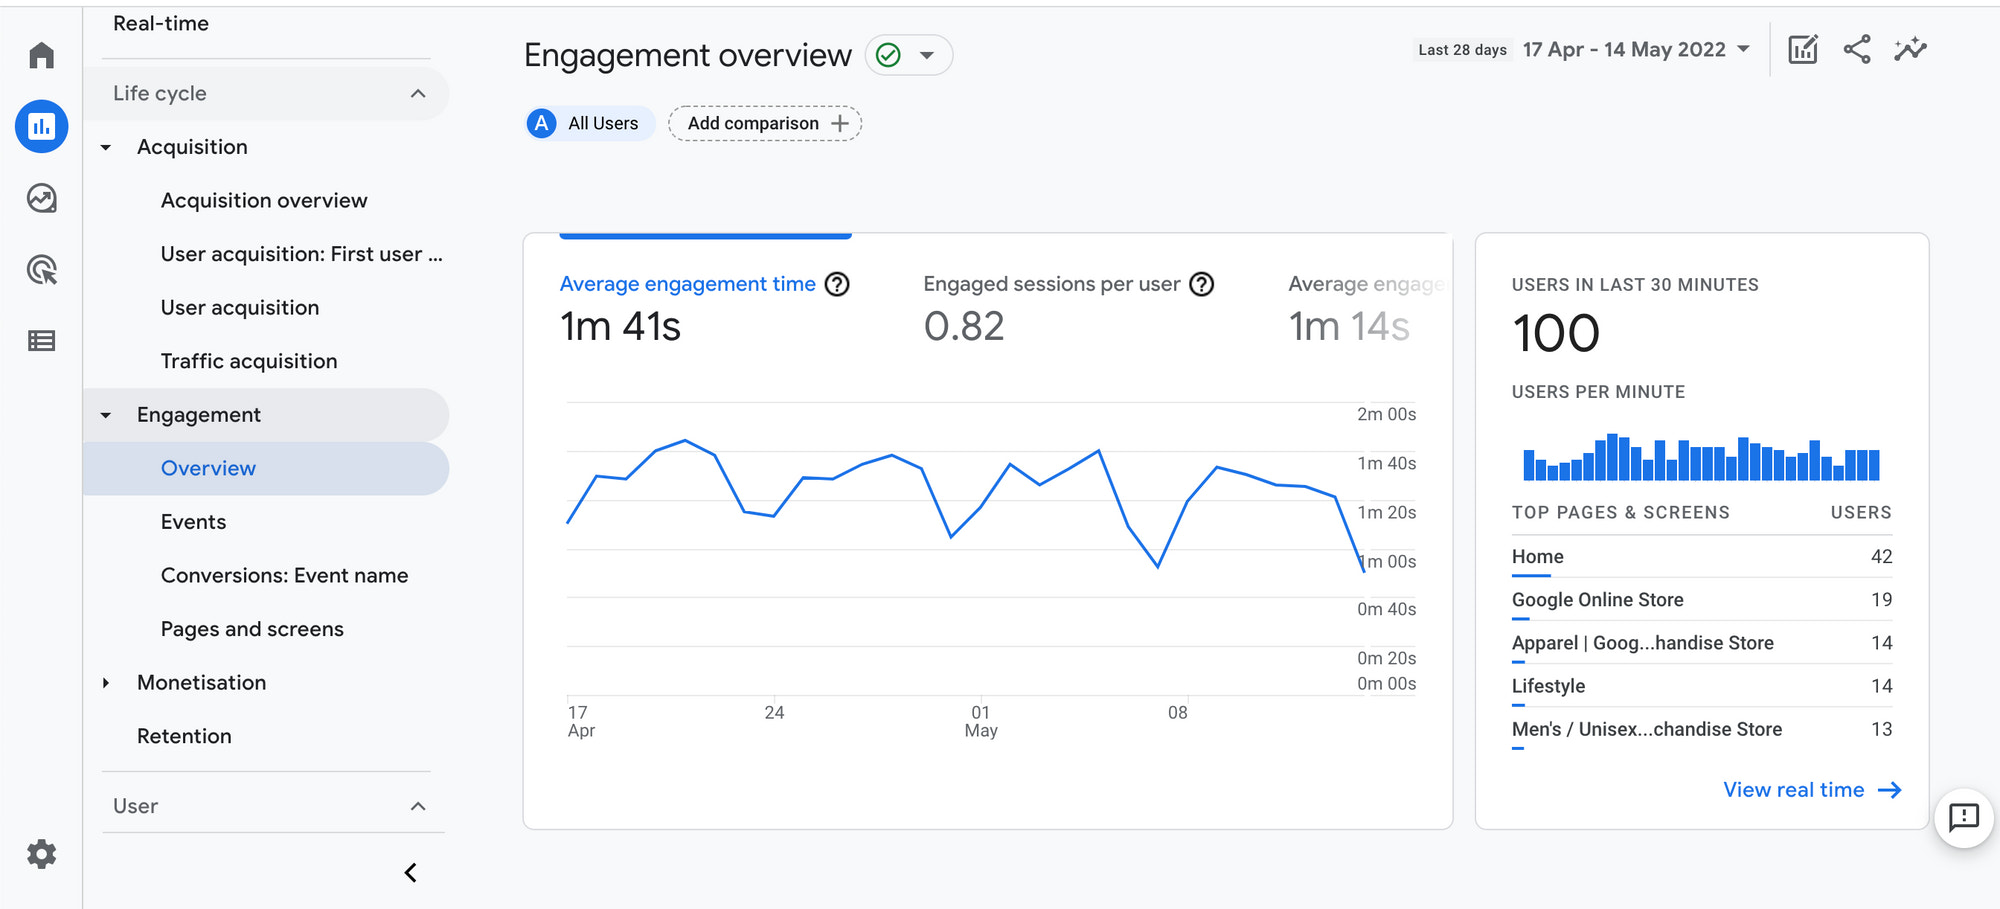
TheEngagement reports部分旨在帮助您提高用彩笔t on your site and analyze how visitors are reacting to it. This includes information on how well your pages keep visitors around, which is a signal valued by search engines that influence yourSEO.
Within this category, you have anEngagement overviewthat displays high level engagement metrics about your site, like how long a user is spending on average on your site, what your most visited pages are, and your “stickiness” among regular visitors to your site.
Like in the Acquisition reports table above, you can search, filter, sort, and add layers for deeper analysis to see which user segments are triggering certain events or which traffic on a specific set of pages is the most engaged.

The following are some key engagement metrics to keep an eye on to gauge the “stickiness” of your website and individual pages:
- Viewsare the number of times a page has been loaded and viewed on a screen (this includes the same user refreshing the page).
- Average engagement timeshows the duration a user spends on average on your website or individual pages. If it’s particularly low on a page where you’d want it to be high (e.g., your About page), it might be an indication that you’re either driving irrelevant traffic or visitors were confused by the content and left.
- Unique scrollsare the number of unique users who made it at least 90% to the bottom of the page.
- Even countis the number of events users triggered on the page.
What can you do with this information?
- Create a better user experience for your visitors, such as investing more in hooking their attention toward the top of your page, or making the content shorter or easier to navigate if users aren’t scrolling through.
- Analyze the engagement on specific pages down to the specific traffic sources on that page.
- See how engaged your user base is over time, based on their daily, weekly, or monthly activity.
Ecommerce purchases report

TheEcommerce purchases reportunder the Monetization section might be the most useful report of all. Platforms like Shopify pass information about your products, sales. and conversions to Google Analytics for further analysis.
This report lets you learn more about what visitors buy on your site, including information about:
- Whichproductsthey buy and in what quantity, and the revenue generated by those products
- Theirtransactions,including revenue, shipping tier, and quantity for each purchase
- Thetime to purchase, or the number of days or sessions it takes to purchase, starting from the most recent campaign through to the completed transaction

The Overview report gives you a breakdown of total revenue and purchasers (including first-time purchasers), as well as purchases by product or coupon. But it’s when you dig into the Ecommerce purchases reports that you’ll uncover specific metrics for each item in your store:
- Item viewsis the number of times a product was viewed.
- Add-to-basketsare the number of times that product was added to a shopping cart.
- Basket-to-view rateis the percentage of total product views that ended with the product added to a cart.
- Purchase-to-view rateis the percentage of views that ended with the product being purchased.
What can you do with this information?
- Identify which products sell well and are best suited for your customer base.
- Diagnose potential friction or uncertainty that may be keeping specific products in a cart from being purchased.
- Measure the revenue per transaction and the number of products per transaction and decide whether to offer better quantity discounts, or eliminate shipping costs if customers meet a minimum dollar amount.
Attribution reports

TheAttribution reportsunder the Advertising section may not be immediately valuable if you’re just starting out, but it’s important for understanding the bigger picture of the customer’s journey to purchase.
Marketing attributionbecomes more important as your marketing budget grows and you add more channels to your mix. It helps you understand what your marketing dollars are doing and how your various investments work together to generate a return through traffic and sales.
Marketing attribution models let you place more or less weight at different touchpoints in that journey depending on the “worldview” you want to see it through (for example, last click attribution gives more credit to the last click before converting).
TheModel comparisonreport makes it easy to easily compare the value of your marketing tactics through the lens of different attribution models, while theConversion pathsreport gives you a look at the timeline of the path to conversion—when certain marketing touchpoints took place and how long after it took for visitors to convert.

What can you do with this information?
- Analyze and compare the dollar value of various marketing channels and tactics.
- Get an overview of how users are interacting with your marketing on the path to purchase.
- 比较你的营销投资对丙氨酸ob欧宝娱乐app下载地址ributable revenue generated from each investment under different attribution models.
Compare different groups of visitors with Google Analytics segments
By default, Google Analytics will show you reports based onalltraffic to your store, along with the general insights most of its users will find useful.
However, you can customize your reports to show information that’s relevant to your context and drill down to analyze more specific segments within your total traffic.
Click theEdit comparisonsicon to bring up the option to select dimensions for the traffic you want to include or exclude from your reports. For example, if you wanted to only see new users who found you through an organic Google search.
Or if you wanted to compare the two segments of visitors who made a purchase and visitors who haven’t made a purchase to understand the patterns that improve the likelihood of making a purchase, such as consuming articles on your blog.

Steer your growth in the right direction with Google Analytics
Understanding thefundamental metricsaround your site and your visitors is absolutely crucial to growing and scaling your business.
You don’t need to be a data analytics wizard to get value from Google Analytics and unearth the kinds ofgolden insightsthat can save you many lost sales down the line.
You just need to log in with the right questions, armed with the knowledge of where to look to find answers.