

One of your marketing team’s main goals is educating your target market about your product. This means helping potential consumers understand what your product does, who it’s for, and crucially, why it’s different from your competitor’s product.
To better understand how to communicate these points of differentiation, marketers sometimes use what’s known as a perceptual map. This tool shows how consumers perceive your product in relation to your competition. Whether you’re a product marketer, brand manager, or content writer, understanding your positioning can help you create tighter, more meaningful messaging.
What is perceptual mapping?
Perceptual mapping is the process of organizing, comparing, and contrasting public perceptions about your product. It provides a snapshot of consumer impressions of your product, called a perceptual map.
A perceptual map differs from another marketing tool known as a positioning map. Although both use diagrams to compare product features, positioning maps focus on an objective, analytical reality, whereas perceptual maps focus on customers’ perceptions, regardless of whether they reflect reality.
For example, anApple Smart WatchandTimex Expedition watch每个售价329美元。在定位地图,他们是ld be in the same place based on price. But to many people, Apple is seen as a premium brand, so these products might have different places on a perceptual map.
Perceptual maps can:
- Identify market gaps and provide insight into how to design your product to fill these gaps.
- Track changes in consumer perceptions, helping you understand how your product is evolving in the market.
- Aid development of marketing campaigns to tailor your product to different consumers’ needs and preferences.
Types of perceptual maps
There are various ways to display a perceptual map, ranging from simple representations of two attributes to complex maps that cross-reference a wider array of attributes. Here are the five main types of perceptual maps:
- Two-dimensional
- Multidimensional
- Spidergram perceptual map
- Joint perceptual map
- Intuitive perceptual map
1. Two-dimensional
A two-dimensional map is the most common type of perceptual map. It plots two different dimensions of a product or brand on two axes. For example, a jewelry brand likeVitaly Designmight map its perceptions along the lines of “expensive” and “fashion forward” and their opposites, relative to other brands. The primary goal of this type of map is to identify gaps and comparison points with other brands.

2. Multidimensional
A multidimensional perceptual map has several preset dimensions instead of just two. As a result, there are no axes, but a scattered set of dimensions onto which brands or products are placed.
For example, in the map below on dinner options, cooking at home is perceived as tasty, having high nutritional value, and being fairly affordable, but not very convenient. On the other hand, ordering fast food is considered tasty and convenient, but not very nutritious or affordable.

3. Spidergram perceptual map
Like a multidimensional chart, a spidergram chart considers many dimensions. The critical difference is that it doesn’t imply tradeoffs. The multidimensional example above implies that if an option is highly nutritious, it can’t also be highly convenient. In a spidergram, the same option can be both. In the example below, we add a fifth element—experiential—and compare two different meal options:


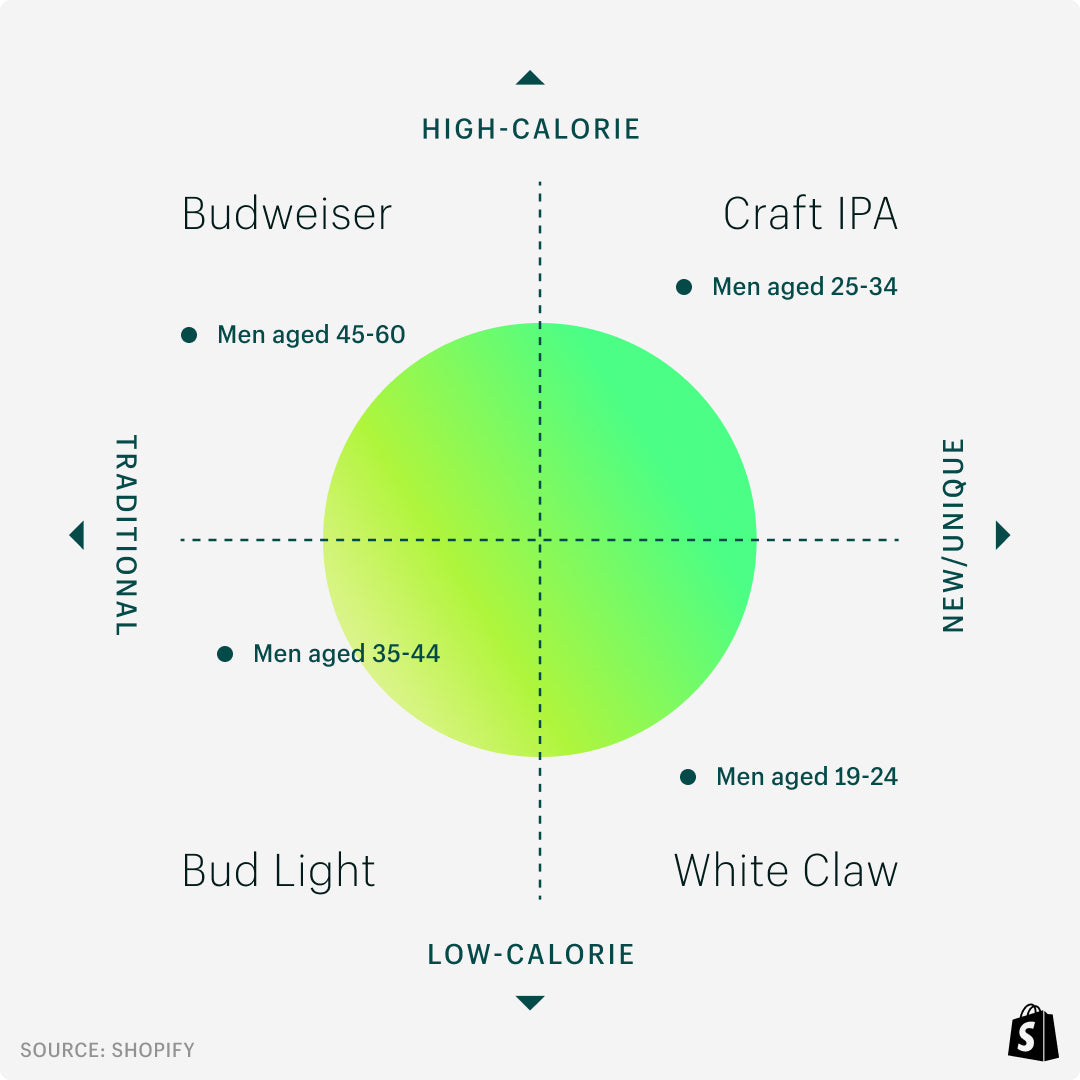
4. Joint perceptual map
Joint perceptual maps are two-dimensional axes-based maps that layer on market segments. These work best when marketers clearly understand how different products or brands serve different customer segments.
The joint perceptual map below on alcoholic beverage options for men layers demographics (age and gender) on top of product dimension preferences (calories and traditional or new). This type of perceptual map works best when the marketers have precise data to back up their hypotheses about product perceptions and consumer preferences.
5. Intuitive perceptual map
An intuitive perceptual map looks the same as a two-dimensional perceptual map, but instead of being informed by market research, intuitive maps are informed by the map creator’s (usually a marketer’s) knowledge of their industry and customer base.
Marketers sometimes start by creating an intuitive perceptual map, follow up with market research, then create a new perceptual map based on that research. Integrating this research can help unearth biases or blind spots marketers may have about their product or brand.
How to create a perceptual map
Regardless of the type of perceptual map you’re making, the process involves four simple steps:
- 定义你的目标
- Establish attributes and hypotheses
- Conduct market research
- Quantify and map results
1. Define your goal
The goal of perceptual mapping is to better understand your target customer. You may be trying to develop a new marketing strategy, refine your messaging, improve an existing product, or identify a market for a new product. Defining your objective helps align those involved and informs the product attributes you decide to map.
2. Establish attributes and hypotheses
Every perceptual map starts with the fundamental building blocks of attributes, also called dimensions. Examples of attributes include price, convenience, flavor, and more. The number of attributes depends on the type of perceptual map (two-dimension, multi-attribute, etc.).
Once you’ve defined your attributes, it helps to create hypotheses about them. To establish hypotheses, you may want to make an intuitive perceptual map, or simply state your own perception: “I believe our product is seen as the most expensive option on the market.”
This step is optional, but it can demonstrate the value of market research in the next step.
3. Conduct market research
There are several ways to gather the data you need to make a perceptual map. Consumer surveys, focus groups, post-purchase surveys, customer feedback interviews, and third-party market data are among the most widely used. Regardless of the market research format, the goal is to create a clear, comparative understanding of the market’s perception of your product or brand.
4. Quantify and map results
The final step is to compile the results of your market research and use them to plot your perceptual map. Perceptual maps are a visual tool, so the goal isn’t usually to be mathematically precise in your plotting—just accurate enough to provide an understanding. It can be helpful first to synthesize the results of a single question’s numerical values and then use that to plot the data.
For example, your survey could ask the consumer, “To what extent do you agree or disagree with the following statement: ‘Product A is affordable.’ 1 means strongly disagree, 5 means strongly agree,” for four different products. Let’s say this produced the following survey data:
Product A: 4.5
Product B: 3.5
Product C: 1.7
Product D: 2.5
You could then graph this information on the vertical axis of perceptual map as follows:

Perceptual mapping FAQ
What is the main goal of perceptual mapping?
The main goal of perceptual mapping is to improve your understanding of how customers perceive your product or brand relative to market competitors.
What are the main features of perceptual maps?
The main features of any perceptual maps are:
- Clearly defined product and brand attributes
- Comparisons between related products and brands
- A focus on perceptions over facts
- Visual plotting of products and brand attributes
What are the four steps to creating a perceptual map?
The four steps to create a perceptual map are:
- 定义你的目标
- Establish your attributes and hypotheses
- Conduct market research
- Quantify and map results
What are the two axes on the perceptual map?
On the most common type of perceptual map, a two-dimensional perceptual map, the two axes are simply X (horizontal) and Y (vertical) axes. These axes can be defined by any attributes the marketer chooses, such as price, quality, or convenience.