

Part of building a successful retail business is understanding and tracking various metrics to keep an eye on your shop’s performance.
Retail metrics are broken down into sales metrics, inventory metrics, and customer metrics. Those insights help you determine where your customer journey might be lacking, what products are most popular, how to increase sales, and more.
In this article, we’re going to dive deeper into what retail metrics are, why they’re so important to business success, and which 16 retail metrics you should be tracking.
Let’s get started.
Table of Contents
What are retail metrics and KPIs?
KPIs, or “key performance indicators,” help you understand your bottom line; they’re the retail metrics that actually matter to your business’s success.They include things like sales per employee, gross profit, foot traffic, and more.
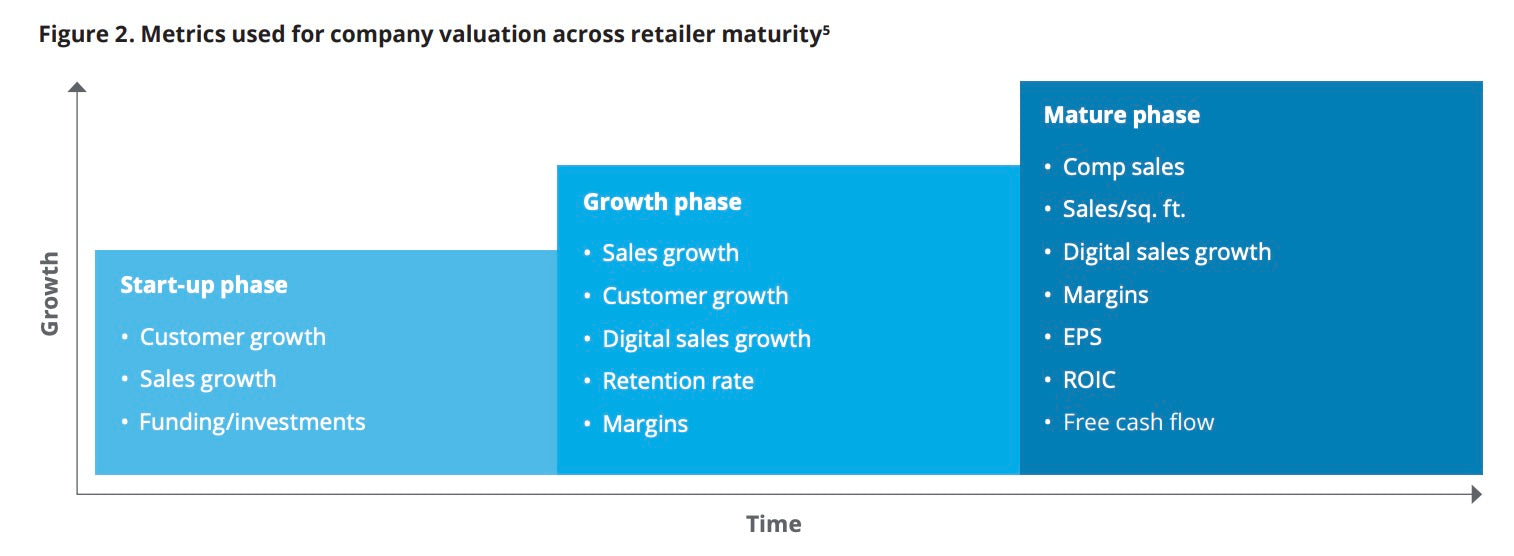
These numbers are important for any retail business, whether it’s abrick-and-mortar storeor a website. They tell you where you might be overspending, which products or collections are less popular than others, or whether you’re meeting your overall goals. They also differ depending on the maturity of your business.
If you don’t keep an eye on your retail metrics, you have no idea how your business is actually performing.
You’re seeing revenue come in, but do you know which products you need to buy more of, which products you need to buy less of, or if your expenses outweigh your revenue?
Importance of monitoring retail metrics
Studies show that tracking your metrics isdirectly correlatedwith your retail store’s profitability. You want to increase your store sales and grow your business, right?
That’s just one reason you need to keep an eye on your KPIs. Here are three more:
Track performance
If you don’t track your performance, you don’t know if your business is booming or in a major lull. While not knowing about the former isn’t necessarily a problem, the latter can sneak up on you and ultimately shut you down.
Tracking performance helps you understand where you need to make changes or improvements to increase sales and customers. It also gives you a comprehensive and transparent view of performance.
While ecommerce sales continue to take a larger percentage of total retail sales, shoppers still appreciate visiting physical stores to see, touch, feel, andtry out items.
And those tactile experiences result in over70% of shoppersspending more in a store visit than when they shop online. However, a recent Deloitte study shows that as of November 2017,75 percent of all in-storeretail spending was digitally influenced during the shopping journey.
It’s a complicated relationship. But to compare in-store to ecommerce sales effectively, merchants need to use a commerce platform that unifies both online and store data.
That’s where Shopify POS comes in. Retailers can readily accept payments in store or online, manage their inventory catalog for both channels, and monitor their store's sales performance with easy-to-understand reports.
PRO TIP:Analyze your POS datain tandem with your ecommerce data to be more cost effective with your inventory, measure your store’s impact on online sales, repeat purchases, lifetime value, and more.
Tracking performance helps you understand where you need to make changes or improvements to increase sales and customers.
Improve forecasting
Sales forecasting is vital to the success of a retail business. To optimize inventory investments and maximizegross margin return on inventory (GMROI), you need to accurately monitor and forecast inventory requirements at theSKU numberlevel for each store.
Achieving this level of forecasting requires analytics. Done well, forecasting can enable you to minimize costs and maximize profits by:
- Stocking ample inventory withoutoverstocking
- Deciding on optimal prices for SKUs
- Designating accurate merchandise and financial targets
Take the guesswork out of restocks
Only Shopify helps you make smarter inventory purchasing decisions. See your most profitable and popular items, forecast demand, get low stock alerts, and create purchase orders without leaving your POS system.
Inform business decisions
如果你不跟踪指标,you’re making business decisions blindly. With detailed data and information about your business’s history, however, you can make informed decisions that lead to improved sales.
With a focus on retail metrics, you can develop strategies that have an impact on key metrics. You can also address how different initiatives influence specific measures and debate performance in critical areas.
16 retail metrics you should track
- Sales per square foot
- Sales per employee
- Conversion rate
- Gross profit
- Net profit
- Average order value
- Basket size
- Year-over-year growth
- Inventory turnover
- Sell-through rate
- Shrinkage
- Gross margin return on investment (GMROI)
- Foot traffic
- Retention
- Foot traffic and digital traffic
- Same-store sales
In this section, we’ll walk you through the most important retail metrics you need to keep track of, and how you can calculate them.
Although it’s best to take advantage of retail management software that can reduce errors, there are ways to calculate these KPIs manually, especially if you’re just starting out with a new retail store and don’t have a backlog of historical figures to work from.
Keeping an eye on these 16 retail metrics will enable you to understand ebbs and flows in your business, improvedemand forecastingand product orders, and make better business decisions. They fall into three general categories:
PRO TIP:Only Shopify POS unifies your online and retail store data into one back office–from customer data to inventory, sales, and more. Vieweasy-to-understand reportsto spot trends faster, capitalize on opportunities, and jumpstart your brand’s growth.
Sales metrics
First, let’s talk about retail sales metrics. These tell you if you’re generating sales at a healthy rate and growing your business.
1. Sales per square foot
这个指标显然是实体的es, to figure out if you’re making the best use of your space. It’s essential for retail businesses with multiple locations, because it lets you see how each one is performing based on the amount of space it has.
To calculatesales per square foot:
Net Sales / Store Square Footage
As noted, it allows you to compare the performance of your locations. This metric can also help you decide whether you need to upgrade or downsize your store, or if you should try rearranging your product into a differentstore layout.
2. Sales per employee
For brick-and-mortar stores, this is an essential metric when planning employee schedules. It enables you to put together your budget for payroll and have a good idea of how many people you can have on the floor at once.
To calculatesales per employee:
Net Sales / Number of Employees
You can take this a step further with a properpoint-of-sale (POS) systemand track sales per individual employee, pinpointing your top performers.
3. Conversion rate
Conversion rateis a metric every business needs to keep track of. Your conversion rate helps you identify how many sales you made out of how many store or website visitors you’ve had.
To calculate your conversion rate:
(Number of Sales / Number of Store or Website Visitors) x 100
A good retail conversion rate to aim for is between20-40%. (Multiplying by 100 in your formula puts your answer in a percentage format.)
This is an easy metric to track for ecommerce stores with access to website analytics, but it can be more challenging when you try to track foot traffic. Consider using traffic counting systems at the door to gauge the number of people coming in each day.
4. Gross profit
Your gross profit is the total amount of profit you’ve made, minus the cost it took to buy or create the product(s).
To calculate:
Total Revenue - Cost of Goods Sold (COGS)
This shows the overall profit you’re bringing in before expenses. It can tell you if your expenses are too high (we’ll talk more about that in the next point) or if you have some wiggle room for investing in other strategies.
5. Net profit
Your net profit is the total profit you’ve made, minusallof your expenses. Essentially, this is how much money goes into your pocket at the end of the day.
To calculate net profit:
Total Revenue - All Expenses
Expenses are administrative costs, operating charges,taxes, salaries, etc.
Your net profit should be high enough that you’re able to make a comfortable living at the end of the day. If you’re spending all revenues on expenses or you’re in the red, it might be time to increase prices.
6. Average order value
Average order value or average transaction value determines how much customers typically spend in your store.
To calculate:
Total Revenue / Number of Orders
A higher average order value means your customers are gravitating toward high-value items or ordering larger quantities of products.
Lower average order value may mean you need to increase prices or provide incentives for ordering more. For example, you might offer free shipping for orders over $50 or $100 to try to increase this metric.
7. Basket size
Basket sizetells you the typical number of items sold per transaction.
To calculate:
Total Number of Units Sold / Total Number of Transactions
Knowing how many items the average customer is buying at a time tells you a number of things:
First, you’ll be able to see if an increase in revenue is due to your customers purchasing more items at once, or if they’re starting to purchase more expensive products. It can also define which employees are performing better, i.e., guiding customers to increase their basket size.
This metric can also help you decide if your products mesh well together. Are customers increasing their basket size because they’re buying a number of products that complement each other? If not, you may want to consider what product offerings you could add to your collection.
8. Year-over-year growth
Year-over-year (YOY) growth tells you if your business is growing. This is an essential metric; when you first start out, you might also consider tracking month-over-month (MOM) growth as well.
To calculate YOY growth:
((Current Year’s Sales - Previous Year’s Sales) / Previous Year’s Sales) x 100
Similarly, to calculate MoM growth (or growth over any other time period):
((Current Month’s Sales - Previous Month’s Sales) / Previous Month’s Sales) x 100
Again, multiplying the result by 100 states it as a percentage. A positive percent would indicate growth, while a negative result would mean your sales have fallen — something you definitely don’t want to see year over year.
Tracking your month-over-month or quarter-over-quarter sales growth can give you early warning of problem areas or falling sales.
库存指标
Now let’s cover a few inventory metrics. These help you decide how much product you need to order and whether some products are being bought more often than others, assisting with overallinventory management.
9. Inventory turnover
Inventory turnover, or stock turn, defines how many times you’ve needed to replace your inventory over a certain period of time.
To calculate:
Cost of Goods Sold / Average Inventory Cost
This is an important metric because it can tell you if you’re ordering too much or too little inventory.
A low stock turn could leave you withdead stock, while a high stock turn might mean you’re not ordering enough, and that customers frequently encounter an “Out of Stock” sign. This can obviously have a negative impact on your customer satisfaction.
10. Sell-through rate
Yoursell-through rateindicates which specific products are overperforming or underperforming, enabling you to adjust how much of that product you keep in stock.
To calculate:
(Number of Units Sold / Starting Inventory) x 100
Knowing this metric for each of your products lets you decide if you need to run a promotion or marketing campaign to help sell underperforming products.
It can also tell you if any of your products are more popular than you expected, and whether you need to order more.
11. Shrinkage
Shrinkagerefers to loss of inventory, but not through sales. This could mean anything from administrative errors or shipping damages to shoplifting or employee theft.
To calculate shrinkage:
Ending Inventory Value - Actual Inventory Value
To combat shrinkage, you first need to find out what’s causing it. Issues like shipping damages should be taken note of when they occur so you can take them into account when calculating shrinkage.
Otherwise, you might need to review security camera footage to see if you can find evidence of theft or clerical errors. Then, take action based on the cause to reduce this in the future.
12. Gross margin return on investment (GMROI)
Your retail store’s gross margin return on investment, or GMROI, refers to your inventory’s profitability.
To calculate GMROI:
Gross Profit / Average Inventory Cost
This calculates the profit margins for your inventory, i.e., how much money your inventory has made you. If your GMROI is low, you can raise prices or look for ways to decrease yourinventory cost.

5 Free Templates to Better Understand Your Inventory
Calculate your businesses cost of goods sold, sell through rate, inventory turnover, saftey stock, economic order quantity, or reorder point with ease using these custom templates. (No math required!)
Get your Inventory Templates delivered right to your inbox.
Almost there: please enter your email below to gain instant access.
We'll also send you updates on new educational guides and success stories from the Shopify newsletter. We hate SPAM and promise to keep your email address safe.
Customer habits
Studiesshow that when a store is able to quantify customer behavior, managers can use that knowledge to maximize store profits. Our last section of major metrics to track focuses on your customers and their buying behaviors.
13. Foot traffic
Foot trafficis the number of customers who enter a physical store.
To calculate,you’ll need traffic-tracking software,客eps track of each new customer who comes into your store.
Tracking foot traffic tells you if awareness of your business is growing, and can determine whether any major marketing campaigns you’re running are increasing consumer interest in your store.
14. Retention
Yourcustomer retention rateis a big one, because it allows you to make sure the new customers you’ve worked so hard to bring in the door are coming back. Retaining customers ischeaper than getting new ones, so you want to find ways to increase customer loyalty.
To calculate customer retention:
((Number of Customers at End of Period - Number of New Customers During Period) / Number of Customers at Start of Period) x 100
To increase customer retention, consider implementing a loyalty program or creating incentives that make your customers want to keep shopping with you.
15. Foot traffic and digital traffic
Foot traffic and digital traffic refers to the number of visitors your store gets both in-person and online. This is an essential metric for businesses with both a brick-and-mortar store and an ecommerce website.
We’ve already gone over how to calculate your foot traffic. To see how much website traffic you’re generating, you’ll need to access website analytics with a tool likeGoogle Analyticsor by using yourShopify analytics.Then, to calculate:
Foot Traffic + Digital Traffic
Make sure these numbers continue increasing. If one isn’t doing as well as the other, try running a promotion to boost it.
16. Same-store sales
Same-store sales is a retail metric used to evaluate the total dollar number of sales in stores that have been operating for more than one year. It provides a performance comparison for established stores in a retail chain over a specific period of time.
Use Shopify POS to track key retail metrics
As a retail business owner, keeping your eye on each of these key retail metrics equips you to improve your business over time. Having a POS system to automate the process can help make sure your measurements are both accurate and up-to-date.
Put your data to work with Shopify
Only Shopify unifies online and physical store data to the same reports. View and analyze sales, customer, product, staff, marketing, inventory, and financial data in the same place and make decisions with confidence.
